Monitoring and Observability A Comprehensive Guide for DevOps Engineers
Monitoring and Observability: A Comprehensive Guide for DevOps Engineers In the fast-paced world of DevOps, maintaining a robust and reliable system is paramount. Monitoring and observability serve as the twin pillars that empower DevOps engineers to gain insights into their systems’ performance, troubleshoot issues proactively, and ensure seamless operations. In this comprehensive guide, we’ll explore the significance of monitoring and observability and delve into strategies to implement these practices effectively.
The Importance of Monitoring and Observability Monitoring vs. Observability Monitoring involves tracking metrics, logs, and events to understand the health and performance of a system. It typically relies on predefined metrics and thresholds.
Observability, on the other hand, encompasses the ability to infer the internal state of a system by analyzing its external outputs. It focuses on understanding why something is happening, providing deeper insights into complex distributed systems.
The Need for Comprehensive Monitoring and Observability Proactive Issue Identification: Early detection of anomalies or performance degradation can prevent system failures and enhance reliability. Faster Incident Response: Immediate access to detailed information facilitates quicker incident resolution, minimizing downtime. Continuous Improvement: Insights gathered through monitoring and observability help in refining systems for optimal performance and efficiency. Implementing Effective Monitoring and Observability Strategies
- Choosing the Right Metrics Identify key performance indicators (KPIs) and metrics that align with your system’s goals and objectives. Utilize tools like Prometheus, Grafana, or AWS CloudWatch to collect and visualize metrics.
- Logging and Tracing Establish centralized logging using tools such as ELK Stack (Elasticsearch, Logstash, Kibana) or AWS CloudWatch Logs for efficient log management. Implement distributed tracing with tools like Jaeger or AWS X-Ray to trace requests across microservices.
- Alerting and Notifications Set up intelligent alerting mechanisms based on predefined thresholds to receive notifications for critical events or performance deviations. Configure alerting channels such as email, Slack, or PagerDuty for timely response to incidents.
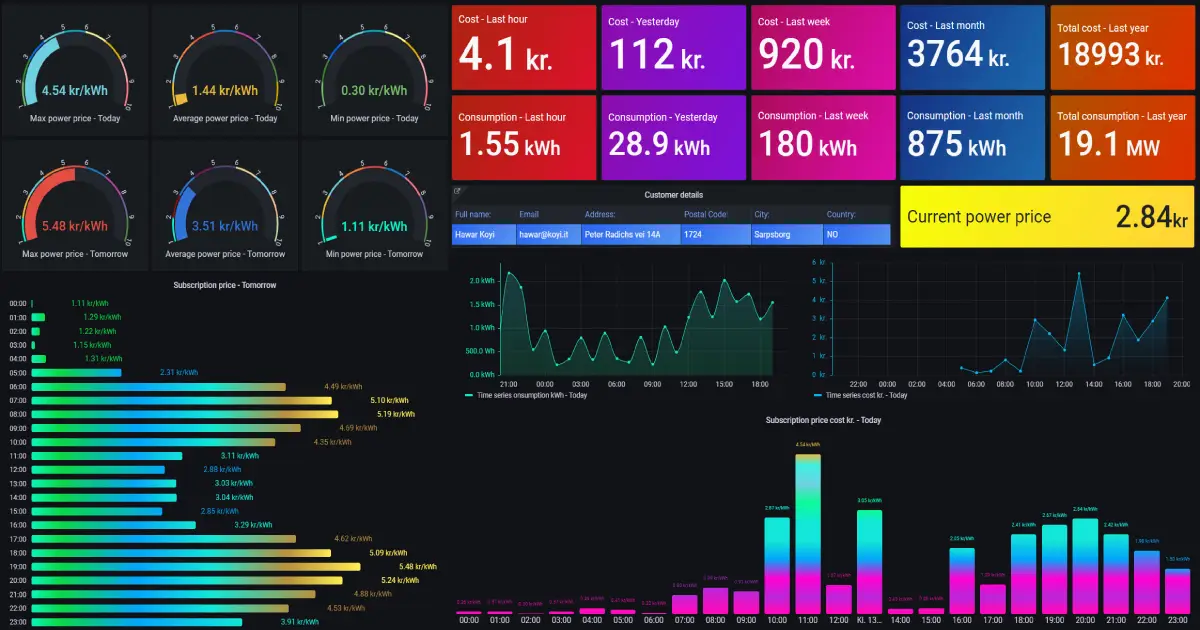
- Dashboards and Visualization Create comprehensive dashboards using visualization tools like Grafana or Kibana, providing a holistic view of system performance and health. Customize dashboards to display metrics relevant to different stakeholders, aiding in decision-making processes.
- Automated Remediation Implement automated responses to certain events or alerts to remediate issues swiftly, reducing manual intervention and response time. Conclusion Monitoring and observability are indispensable components of a robust DevOps strategy, offering insights that drive continuous improvement and operational excellence. By leveraging a combination of appropriate tools, defining relevant metrics, establishing effective logging and tracing, configuring intelligent alerting systems, and visualizing data through intuitive dashboards, DevOps engineers can gain a comprehensive view of their systems and ensure uninterrupted service delivery.
Remember, the landscape of monitoring and observability tools is vast and continuously evolving. Choose tools that best suit your infrastructure, objectives, and team’s expertise. Regularly reassess and refine your monitoring strategies to adapt to the evolving needs of your systems, ultimately fostering a culture of resilience and reliability in your organization’s operations.